Quickstart Guide
This guide demonstrates how to quickly get started with PST by combining the spectra of several Simple Stellar Populations (SSPs) and calculating their photometric properties.
Minimal Working Example
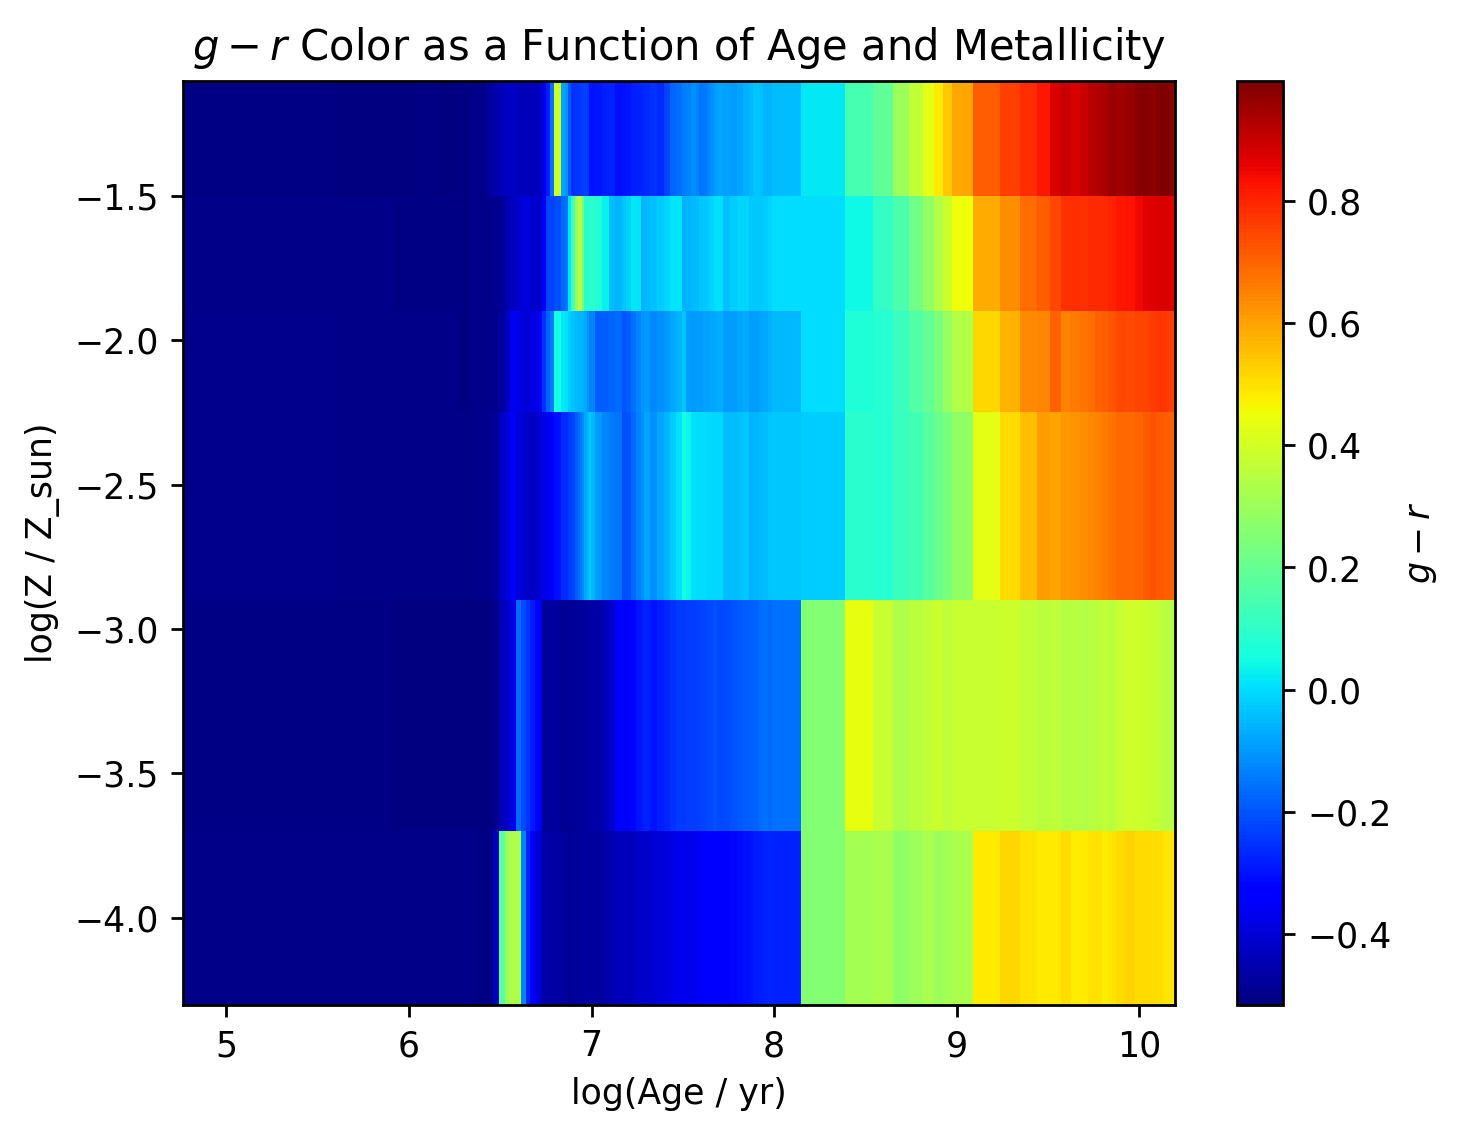
In this example, we’ll load a Single Stellar Population (SSP) model using the PopStar library, calculate photometry for multiple SSPs, and plot the g - r color as a function of stellar age and metallicity.
Step-by-Step Breakdown
Import the necessary modules: Start by importing the PopStar model for SSPs, a function to load photometric filters, and standard libraries like numpy and matplotlib for calculations and plotting.
Define the Initial Mass Function (IMF) and redshift: We’ll use the Chabrier IMF (2003), which is commonly used in stellar population studies, and set the redshift to 0.0, representing local observations.
Load photometric filters: Photometric filters allow you to calculate synthetic magnitudes from the SSP spectra. Here, we load the g and r filters from the SDSS system.
Initialize the SSP model: We’ll create a PopStar instance, passing in the IMF as a parameter.
Compute the photometry: We calculate the photometric flux for each SSP in the selected filters and convert the results to AB magnitudes.
Calculate the color (g - r): This is a simple subtraction of magnitudes in the g and r bands.
Visualize the results: Finally, we plot the g - r color as a function of SSP age and metallicity.
Code Example
Here’s the complete code for this workflow:
from pst.SSP import PopStar
from pst.observables import load_photometric_filters
import numpy as np
from matplotlib import pyplot as plt

# Define the IMF and redshift
imf_type = 'cha'  # Chabrier 2003 Initial Mass Function
z_redshift = 0.0  # Redshift at which the SSPs are observed

# Load photometric filters (g and r bands)
list_of_filter_names = ["SLOAN_SDSS.g", "SLOAN_SDSS.r"]
filters = load_photometric_filters(list_of_filter_names)

# Initialize the SSP model
ssp_model = PopStar(IMF=imf_type)

# Compute photometry for the SSPs in the selected filters
photometry_fluxes = ssp_model.compute_photometry(filter_list=filters,
                                                 z_obs=z_redshift)

# Convert fluxes to AB magnitudes
magnitudes = -2.5 * np.log10(photometry_fluxes.to_value("3631 Jy / Msun"))

# Compute g - r color
color = magnitudes[0] - magnitudes[1]

# Plot the color as a function of stellar age and metallicity
plt.figure()
plt.pcolormesh(np.log10(ssp_model.ages.value),
               np.log10(ssp_model.metallicities.value), color,
               cmap='jet')
plt.colorbar(label=r'$g - r$')
plt.xlabel('log(Age / yr)')
plt.ylabel('log(Z / Z_sun)')
plt.title(r'$g - r$ Color as a Function of Age and Metallicity')
plt.show()